Statistical interactions between variables with Python
Introduction
Statistical interactions are important to take into account when looking at relationships between variables. An interaction occurs when the relationship between two variables is affected (or "moderated") by a third variable. Jim Frost calls these "it depends" interactions, meaning the effect of one variable on another depends on a third. For a comprehensive overview of interaction effects, please check out Jim's blog post on the subject—it's much more informative than what I could put together, but I'll provide a brief overview here, before showing how we might explore this in Python.
A classic example of an interaction effect is to imagine we're conducting an experiment that looks at the enjoyment of different food condiments. Let's say our explanatory variable, therefore, is food condiment (categorical with two levels: "soy sauce" and "tomato sauce"), while our response variable is condiment enjoyment (say, on a scale of 1 to 10; how much did you enjoy this soy sauce?). Of course, the enjoyment of a food condiment really depends on the type of food that you're eating! So we should look at a third variable, say, a categorical variable that describes the meal that you've been given. If we have two meals, sushi and burgers/fries, we can see that the enjoyment of soy sauce compared to tomato sauce will probably change, depending on the meal. We'll probably enjoy soy sauce if it's sprinkled onto some sushi, but enjoy it rather less if we cover our fries with it! So this is our statistical interaction: the enjoyment of food condiments is moderated by the type of meal.
Since I don't actually have any data on food condiments, we're instead going to use the mpg dataset to look at fuel efficiency. We'll see how fuel efficiency depends on engine displacement, and check whether a third variable—number of engine cylinders—moderates that relationship at all. Since fuel efficiency (in miles per gallon, or mpg) and engine displacement (in some sort of volume measurement... hopefully cubic centimetres, but possibly cubic inches for our American friends) are both continuous numerical variables, we'll just use a Pearson correlation coefficient to determine the extent of their relationship. Check out my previous post for a bit more on the Pearson coefficient if you're interested.
Set up
We'll load up some libraries and the dataset, and then subset it to only include cars with four, six or eight cylinders (this accounts for the vast majority of the observations anyway):
import pandas as pd
from scipy import stats
import seaborn as sns
import matplotlib.pyplot as plt

mpg = sns.load_dataset('mpg')

cyls = [4,6,8]
mpg = mpg[mpg.cylinders.isin(cyls)]
Sense check
Next, it's a good idea to just have a quick look at the relationship between engine displacement and fuel efficiency, regardless of any potential interaction effects. So, we'll make a quick scatterplot:
plt.scatter(x=mpg.displacement, y=mpg.mpg)
plt.xlabel('Engine displacement')
plt.ylabel('Miles per gallon')
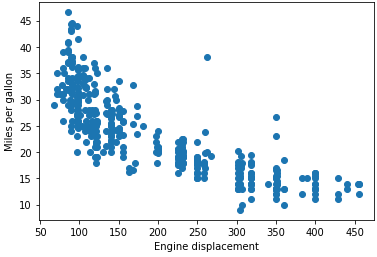
It's pretty clear there's a relationship between the two: as engine displacement increase, fuel efficiency decreases. We can formalise this correlation by running a quick Pearson test on the relationship:
stats.pearsonr(mpg.mpg, mpg.displacement)We end up with an r of –0.82 and a vanishingly small p-value; there is a strong negative correlation between engine displacement and fuel efficiency, and this is almost certainly not due to chance.
The moderating effect of number of cylinders
We now turn to the question of whether any other variables could moderate the effect of engine displacement on fuel efficiency. In this case, we're particularly interested in number of cylinders: does the correlation between engine displacement and fuel efficiency change with the number of cylinders? For a quick view, we can construct a facetted plot of fuel efficiency by displacement, for the three different cylinder categories:
g = sns.FacetGrid(mpg,
    col="cylinders")
g.map(sns.scatterplot, "displacement", "mpg")
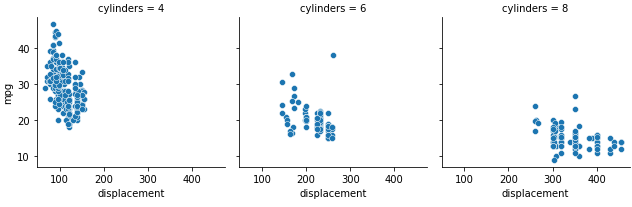
Indeed, it appears as if the effect of engine displacement on fuel efficiency changes with the number of cylinders. For eight-cylinder cars, the fuel efficiency is already generally very low, and increasing engine displacement doesn't appear to have as pronounced an effect on fuel efficiency as it does in the four-cylinder group. To formalise this difference, we'll loop over the different cylinder categories, subset our data and apply Pearson correlation coefficient tests for each category:
for i in cyls:
    subset = mpg[mpg.cylinders == i]
    print('Miles per gallon predicted by engine displacement for ' + str(i) + '-cylinder cars')
    res = stats.pearsonr(subset.mpg, subset.displacement)
    print('Pearson correlation coefficient: ' + str(res[0]))
    print('Associated p-value: ' + str(res[1]))
    print('')
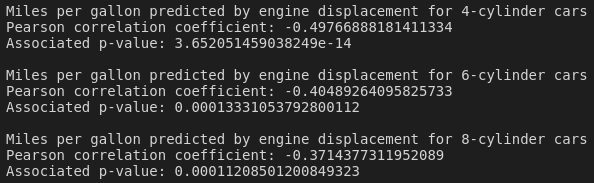
As we can see from the results above, the strength of the correlation between engine displacement and fuel efficiency is highest among the four-cylinder cars, and weakest among the eight-cylinder cars. All correlations have statistically significant associated p-values.
Conclusion
It's quite interesting that the r value of the four-cylinder car group (i.e., the group with the strongest correlation between engine displacement and fuel efficiency) is only –0.498, considering that the r value for the entire dataset (all cylinders, r = –0.82) indicated a much stronger relationship. When we subset the dataset on number of cylinders, the range of values for both fuel efficiency and engine displacement are restricted considerably, and so the resulting effect sizes are decreased. In this case, while there is a small moderating effect of number of cylinders on fuel efficiency as predicted by engine displacement, it's not clear that this is a particularly useful distinction to make.
You can find all the code used in this post here.