Behavioural psychology and Python: Part 1
In The Undoing Project, Michael Lewis's excellent book about two groundbreaking behavioural psychologists, we get a glimpse at some of the mechanisms that drive our judgements and decisions. By coming up with interesting questions to pose to people, Amos Tversky and Daniel Kahneman discovered what they labelled "heuristics": rules of thumb that inform our behaviour. Some of these heuristics are quite fascinating.
For example, in their paper Subjective Probability: A Judgment of Representativeness, they detailed the representativeness heuristic. According to Kahneman and Tversky, when we make predictions about the probability of some event occurring (hence "subjective probability"), we aren't actually running statistical algorithms in our head; we're using rules of thumb to come up with an answer that's good enough. That is, we're using heuristics. The representativeness heuristic says that when we make judgements, we're looking at whatever it is we're judging, and comparing it to our mental model of the typical thing that we're judging against. This is usually fine, and it serves us pretty well. We wouldn't have developed something like this if it wasn't useful! However, sometimes the heuristic doesn't work. One such scenario is when we're judging things that have a random component.
Imagine that in your city, there are two hospitals. One is much larger than the other. On average, there are 45 babies born in the larger hospital every day, while there are only 15 babies born in the smaller hospital every day. Of course, you know that there is about a 50:50 chance for a baby to be either male or female. You also know that on some days, more boys are born than girls, and vice versa. Over the course of one year, which hospital would have more days when more than 60% of the babies born were boys?
A: The larger hospital. B: The smaller hospital. C: About the same (within 5% of each other).
Your reasoning might go something like this: Well, the chance for a baby to be born a boy or a girl is about equal, so both hospitals should have about the same number of days when more than 60% of new babies are boys. Let's go with C.
If you thought that, you would be in the majority; most people guess C. Actually, the smaller hospital would generate far more days when more than 60% of the babies are boys. Let's think about it a different way. Say you flip a coin three times. What's the probability that you'll get two tails and one heads? Well, it's 0.5 x 0.5 x 0.5 = 12.5%. Just the same as the seven other combinations of heads and tails. Okay, now flip that coin a million times. What's the probability that you'll get 666,666 tails and 333,334 heads? Pretty much nonexistent!
So what's going on? Why do we intuitively seem to think that both hospitals would have roughly the same number of days for which there is a significant difference in the birth rate for boys and girls? It goes back to the representativeness heuristic. When we're making judgements about the hospital, we're comparing it with our mental model of a hospital. We're thinking, Okay, one hospital is smaller than the other, but they're both hospitals! They'll both have ambulances coming and going, white walls, hand sanitiser by the lifts, doctors and nurses hurrying about... They're pretty damn similar! We are ignoring the effect that the different sample sizes (i.e., 15 vs 45) will have on the results, because sample size doesn't have anything to do with our mental model of a hospital. Here's what Tversky and Kahneman say in their abstract:
"...since sample size does not represent any property of the population, it is expected to have little or no effect on judgment of likelihood."
Knowing these heuristics, knowing what our minds do in the background when we're making judgements or predictions, can be really useful. But what's even cooler is being able to write a few lines of code to prove to ourselves that sample size really does matter, and that the smaller hospital really will generate many more days of uneven birth distribution! Let's use Python for this.
We'll use matplotlib to plot, and random.randint() to simulate the 50% chance of giving birth to a male or a female.
import matplotlib.pyplot as plt
import random
Next, we'll define our function to simulate births over a 365-day period. It has one parameter, births_per_day, to which we'll pass either 45 (to represent the large hospital) or 15 (small hospital). It will return the total number of days (out of 365) where more than 60% of the babies born were boys (len(total_uneven_days)). We'll use random.randint(0, 1) to decide randomly whether a boy or a girl is born, and we'll say that females = 1, and males = 0. We append those values to a list, births. That way, when we sum births, we get the total number of females born that day (females). If females / births_per_day is less than 40%, then we append a marker value to total_uneven_days.
def simulate_yearly_births(births_per_day):

    # instantiate empty list
    total_uneven_days = []

    # for each day
    for day in range(365):

        # today's births list
        births = []

        # for each baby
        for baby in range(births_per_day):

            # assign male or female
            births.append(random.randint(0, 1))

        # get total number of females
        females = sum(births)

        # check if there are <40% females; if so, append '1' to
        # total_uneven_days list
        if (females / births_per_day < .4):
            total_uneven_days.append('1')

    # return the number of days
    return(len(total_uneven_days))
Alright! Let's see what happens when we run this simulation.
>>> simulate_yearly_births(45)
29

>>> simulate_yearly_births(15)
50
The smaller hospital had nearly twice as many days when more than 60% of the babies born were boys! Okay, that's just one year, though. Let's make this a little bit more robust, and see what happens when we run this over 100 years. (This might take a few seconds to run!)
# instantiate lists to append results to
large_hospital = []
small_hospital = []

# run simulation 100 times
for i in range(100):
    large_hospital.append(simulate_yearly_births(45))
    small_hospital.append(simulate_yearly_births(15))
We can look at the lists if we want to, but it's probably better to make a quick histogram so we can get a good visual idea of the distribution of results.
# plot both lists as histograms on one plot
fig, ax1 = plt.subplots()
ax1.hist([large_hospital, small_hospital],
    label = ['Large hospital', 'Small hospital'],
    bins = 30)
ax1.set_xlabel('Number of days with uneven birth rates')
ax1.set_ylabel('Count')
ax1.legend(loc = 'upper right')
plt.show()
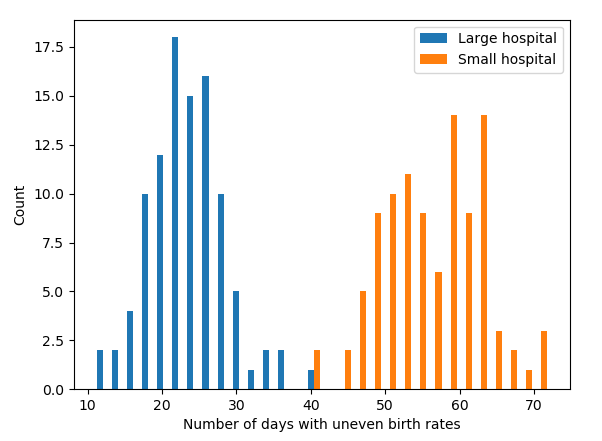
That's pretty clear, right? Now you'll never forget the importance of sample size! You can check out the full code for this post here.