Simple logistic regression with Python
Python Statistics and data science
18 February, 2021
Introduction
I won't bore you with "Hey, let me tell you about the Titanic disaster!"—we all know about the Titanic—but there's a pretty nice dataset floating around the internet that we can use to construct a logistic regression model in Python. Logistic regression deals with binary outcomes, i.e., 1s and 0s, Trues and Falses. The morbid suitability of the Titanic dataset, of course, is that our outcome is whether the passenger survived or not. In this post, we'll talk about creating, modifying and interpreting a logistic regression model in Python, and we'll be sure to talk about confounding variables and odds ratios as well.
The data
The seaborn library comes packaged with the dataset, so we can load it in and see what we're working with:
import seaborn as sns
import numpy as np
import pandas as pd
import statsmodels.formula.api as smf

dat = sns.load_dataset("titanic")
dat.info()
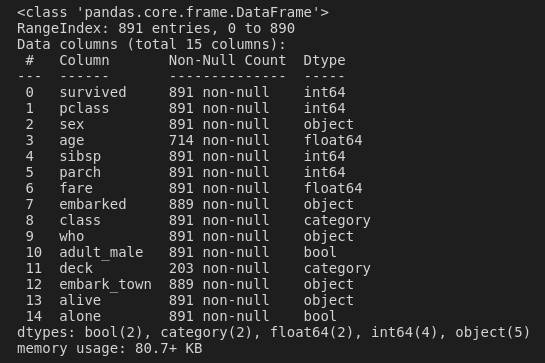
So we have a data frame comprising 891 observations of 15 variables. survived is our binary response variable. In logistic regression, we want our response variable to be coded 0 (no outcome) and 1 (outcome); luckily for us, that's how these data already are. There are a bunch of other variables here, but we'll probably only be interested in a few that could feasibly have an effect on survival. These could include sex (were females more likely to get a spot on the life boats than males?), age (perhaps children were more likely to get a spot than adults?), fare (how much did they pay for the ticket—were the cheap seats more dangerous!?), and, I guess maybe we can also look at embark_town; where they boarded.
Side note: This dataset seems to get a lot of attention in machine learning competitions and things like that. In those contexts, you'll probably split your data into training and test sets; build a predictive model on the training set; and then see how well you did at predicting the observations in the test set. I think that's a great way to learn about predictive modelling, but I can't help but feel like it's kind of a weird example. Who cares if you're able to predict with good sensitivity and specificity whether someone on the Titanic would have died or not? We don't always have to build predictive things. After the fact (i.e., over a 100 years later), it's more useful to know which factors were associated with survival, rather than knowing that we've created an amazing model that can predict data that's been available for decades.
Our first logistic regression model
The syntax is basically the same as other regression models we might make in Python with the statsmodels.formula.api functions. Our first formula will be of the form <response> ~ <predictor>; our predictor variable will be sex. This is what it looks like:
reg = smf.logit('survived ~ sex', data=dat).fit()
print(reg.summary())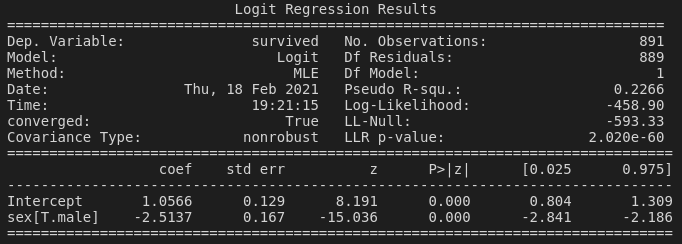
If you've checked out some of my other recent posts on regression, hopefully this will look pretty familiary. The interpretation is similar in theory, but there are a couple of differences compared to linear regression that we should talk about.
Firstly, our coefficient is described as sex[T.male]. There's no mention of female, and that's because with categorical explanatory variables, the first level of the variable will be used as the reference. The female group in the sex variable is being used as the reference, against which all the other levels of the variable will be compared. (In this case, there's only one other level—male.) So, our coefficient of –2.5137—being less than zero—means that males are more likely to have died than females (the reference level). Probably more accurately, the negative coefficient means that males were less likely to achieve the outcome of our response variable, i.e., survival.
Of course, this is meaningless if we don't look at the p-value; but in this case, our p-value is <0.001. So, indeed, males were less likely to survive the Titanic than females. But to what extent?
Odds ratios
An important way to quantify these effects is by using odds ratios. These describe the probability of an outcome occurring in one group compared to the probability of that outcome occurring in another group. In our context, an odds ratio will hopefully give us some concrete reference point: how much more likely were you to survive if you were a female on the Titanic, compared to a male?
An odds ratio equal to 1 implies that there is no difference between the two groups (so any effect will be non-significant). For categorical variables, an odds ratio greater than 1 means that the group in question is more likely than the reference group to be associated with the outcome of the response variable. An odds ratio less than one means that the group in question is less likely to be associated with the outcome of the response variable.
That's a little bit wordy, but I think it makes a bit more sense with continuous variables. For example, if we found that age was a significant predictor of survival, where the older you were, the more likely you were to survive, then our odds ratio would be greater than 1. In this context, an odds ratio greater than 1 means that as the explanatory variable increases, the response variable increases. (And vice versa.)
Anyway, the odds ratio is just the natural exponentiation of our parameter estimate (haha... obviously...):
np.exp(reg.params)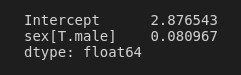
We could interpret this as implying that males were around 8% as likely to survive the Titanic as females. To be honest, though, I think it's more natural to think of things the other way around: How many times more likely were females to survive than males? To do this, we just need to relevel our sex variable so that males are the reference level, rather than females:
dat['sex_releveled'] = pd.Series(pd.Categorical(dat.sex, categories=["male", "female"]))
reg = smf.logit('survived ~ sex_releveled', data=dat).fit()
np.exp(reg.params)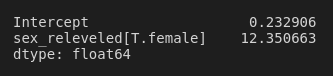
Wow: females were around 12 times as likely to survive than males! Quick side note: If you were to print a summary of this model (where the only thing we changed was relevelling the sex variable), all of the statistics would be the same except for the sign on the coefficient and z-score. So instead of a coefficient of –2.5137, the coefficient is 2.5137, indicating that females are more likely to have survived (rather than saying that males were less likely to have survived—the same thing, right?).
One final thing we probably shouldn't forget to do is to add confidence intervals! This nifty bit of code was shown to me by the lecturers for the Coursera Regression Modeling in Practice course, and we'll use it here to create a quick summary table of the odds ratio and accompanying confidence interval:
params = reg.params
conf = reg.conf_int()
conf['OR'] = params
conf.columns = ["Lower CI", "Upper CI", "OR"]
np.exp(conf)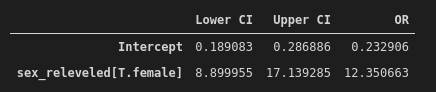
So, with a 95% confidence interval, females were somewhere between 8.9- and 17.1-times more likely to survive the Titanic than males.
Adding more variables
It's a good idea to add more variables to our model. For one thing, they might tell us more interesting things. But more importantly, they'll help us to account for potential confounding of our explanatory variables. I think the best way to understand this is to see an example.
When we construct a logistic regression model where survival is predicted solely by the age variable, the resulting coefficient is –0.0110 with a significant p-value of 0.040. This implies that there is a weak correlation between age and survival; as age increases, survival decreases.
reg = smf.logit('survived ~ age', data=dat).fit()
print(reg.summary())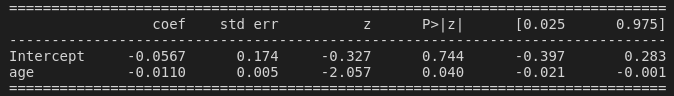
However, now see what happens when we add the variable sex into the model:
reg = smf.logit('survived ~ age + sex', data=dat).fit()
print(reg.summary())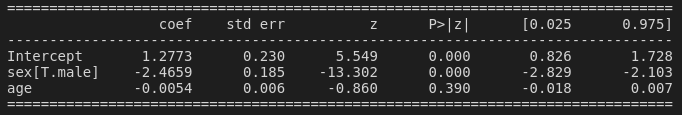
Suddenly, the p-value for age has shot up to 0.390! We can say that sex confounds the relationship between survival and age. By adding sex to the model, we're being forced to look at the effect of age on survival, while accounting for sex. One way to explain this confounding is that perhaps more of the older population on the Titanic were male; and since we know that males are much more likely to have died, then if we ignore sex, it might look like older people are more likely to have died as well! This is why it's really important to think carefully about our models, and to include all the potential confounding variables that we're able to.
The final model
We're going to finish up here by adding a couple more explanatory variables into our model. embark_town is a categorical variable with three levels: Queenstown, Southampton and Cherbourg. fare is a continuous variable (i.e., ticket price).
reg = smf.logit('survived ~ age + sex_releveled + fare + embark_town', data=dat).fit()
print(reg.summary())
params = reg.params
conf = reg.conf_int()
conf['OR'] = params
conf.columns = ["Lower CI", "Upper CI", "OR"]
np.exp(conf)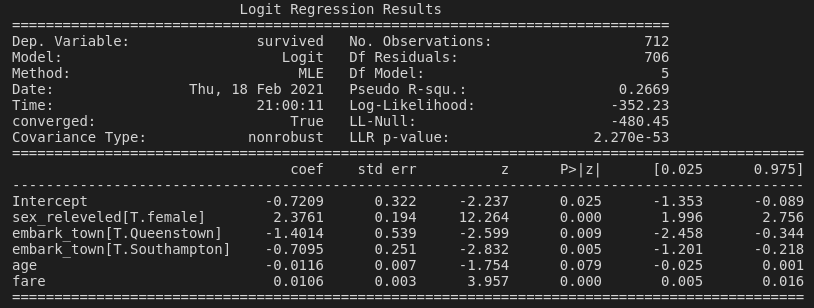
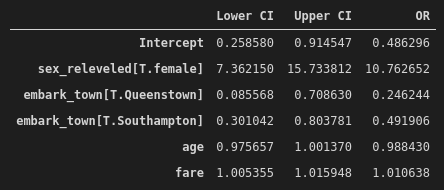
After accounting for the potential confounding effects of age, fare price and town of boarding, the odds of surviving the Titanic disaster were more than ten times higher for females than males (OR = 10.76, 95% CI = 7.36–15.73). The town of boarding was also found to be significantly associated with survival, where those that embarked in Southhampton were about half as likely to survive as those that embarked in Cherbourg (OR = 0.49, 95% CI = 0.30–0.80), even after accounting for fare price, age and sex. While fare was significantly associated with survival, the effect was trivial (OR = 1.01, 95% CI = 1.005–1.011).
You can find all the code used in this post here.
Hai Nguyen 25 February, 2024
Thank you for your text. It is very easy to understand. I have one question!
Can we analyse the significant of cofounding between 'age' and 'sex'. In other language, for example R, can we use: glm(survived ~ age + sex_releveled + fare + embark_town + age*sex ) . I do not know if we have similar in Python? Thanks!